
Give evidence a place
THE SHARED MAPQuantum measurements contribute their geometry. Tavnit and Netzer transform classical records into comparable forms. Sources stay attached, including records whose importance is not yet apparent.
You cannot ask a question you do not know exists.
A document, measurement or transaction can seem unimportant until its connections reveal why it matters. Quantum Trellis brings quantum and classical evidence onto a shared geometric map. One neighbourhood connects to another, opening a trail through information nobody thought to examine together.
Quantum Trellis and the Data Lake reveal candidate connections. Tomography follows them back to the records and examines the evidence from several views. Prosdocimi brings this workflow into market investigation: challenge the explanation, establish what it supports, and preserve what was learned.
Don’t get lost in quantum: observation points, a shared map, and discovery →
The Trellis and Data Lake show which clues could belong together. Tomography follows those clues back to their records and examines them from several views. Prosdocimi gives this handoff a market application: test the explanation, then retain what the evidence supports.
 Find the connection
Quantum Trellis + Data Lake
Which observations deserve a closer look?
 Challenge the explanation
Prosdocimi + Causal AI
What does the market evidence actually support?
 Keep what was learned
EcoSynQ Memory
What survived, what failed, and what changed?

SO WHAT? A falling commodity price is a lead. A purchase contract can change what it means. See the complete investigation.

See how the results meet, where GPU parallel throughput helps, and what the customer can investigate next.
WHAT TO LOOK FORSee separate sources meet. Quantum evidence, Tavnit and Netzer contribute geometry to a shared region. Then follow the sector story through materials, industries and companies. Each connection opens another set of records to investigate.
 LEARN MOREWhat are the mountains, spheres and light showing me?What you’re seeing. What’s different. Why it matters to you.
Information that seems unimportant can become the missing connection.
An overlooked contract can change what a commodity movement means for a business. Following the connections gives the customer a focused procurement question, the source records and a next action. The opportunity is to discover why information belongs together, including records nobody expected to matter.
The lake represents our distributed cloud. Mountains identify quantum-computer providers, Tavnit and Netzer. Their beams contribute evidence to a shared geometric neighbourhood. White pearls represent classical records; onyx nodes trace the sector story. The cyan region shows compatible observations meeting. The sector path illustrates how one connection can lead through materials, industries and companies.
A search starts with something you know to ask for. Here, geometric relationships give you a reason to examine records together before you know the final question. One neighbourhood can connect to another. Tomography then examines the connected set from several views. The lake’s animated joins illustrate this mechanism; they are not measured links between customer documents.
A candidate relationship, the path through contributing records, and a next review or measurement. In the lumber example, follow the material-to-company path, then inspect purchase contracts and their effective dates.
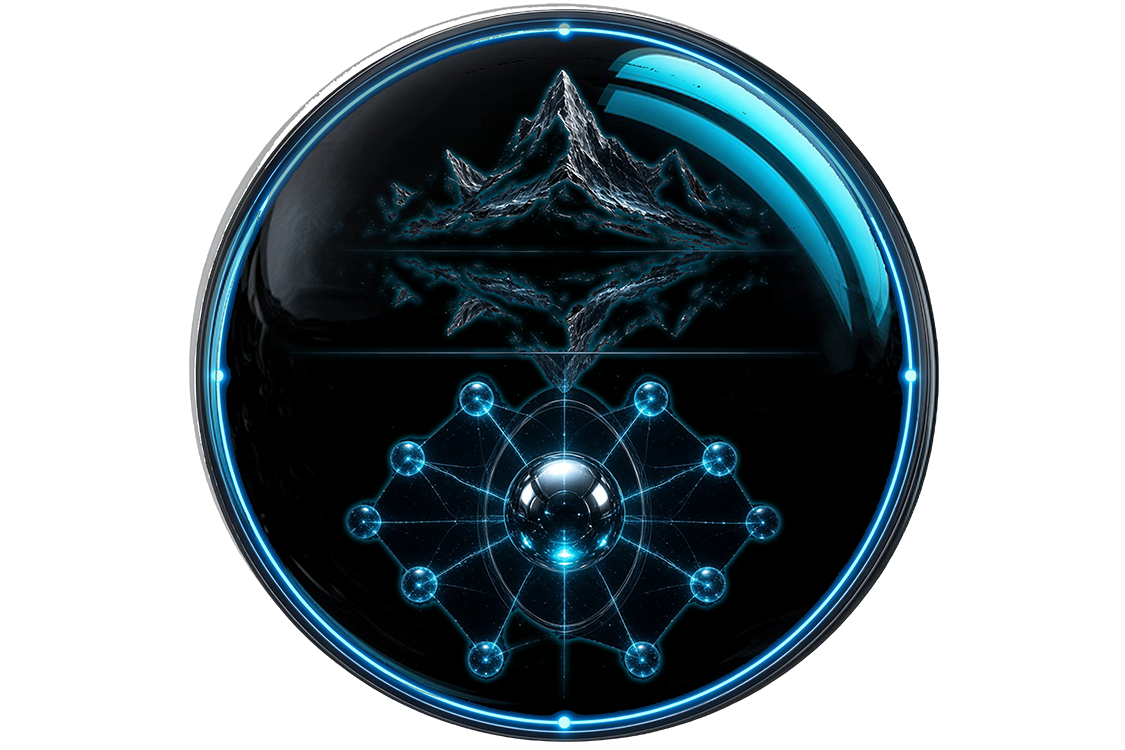
Mountains identify sources. Coloured geometry represents quantum observations; white pearls represent classical examples. Watch the cyan region form, then choose a sector to follow a connection.
Your view is loading quietly in the background.

A geometric match is a starting place. One neighbourhood can connect to another, bringing seemingly unrelated records into the same investigation. Tomography examines that connected evidence from several views, helping reveal a structure that is difficult to see one record at a time.
The eureka is a question you did not know to ask, with the connected evidence that made it visible.
LEARN MOREHow does a trail of records become a discovery?What you’re seeing. What’s different. Why it matters to you.Examine what the connected evidence reveals together.
Your team gets a new lead, the connected records and a practical next investigation. That may mean reviewing an overlooked supplier dependency, comparing geological layers or testing a research question. The eureka is discovering what deserves investigation; the contributing evidence lets you test why it matters.
After geometric comparison identifies a connected set, tomography examines that evidence from several views. In this public demonstration, moving planes scan bundled records across geography, sectors and time. Open a highlighted record and follow its references. These snapshots illustrate scanning separately from the Data Lake; a lake selection is not passed into this scene.
A list tells you which records were found. Tomographic views help you examine the structure across those records. A connection that seems unimportant in isolation can become significant within the wider pattern, revealing a question that was absent from the original search.
A connected evidence set, the pattern that prompted a new question, and the records needed to test it. Record which comparisons support the lead, which challenge it and what evidence is still missing.
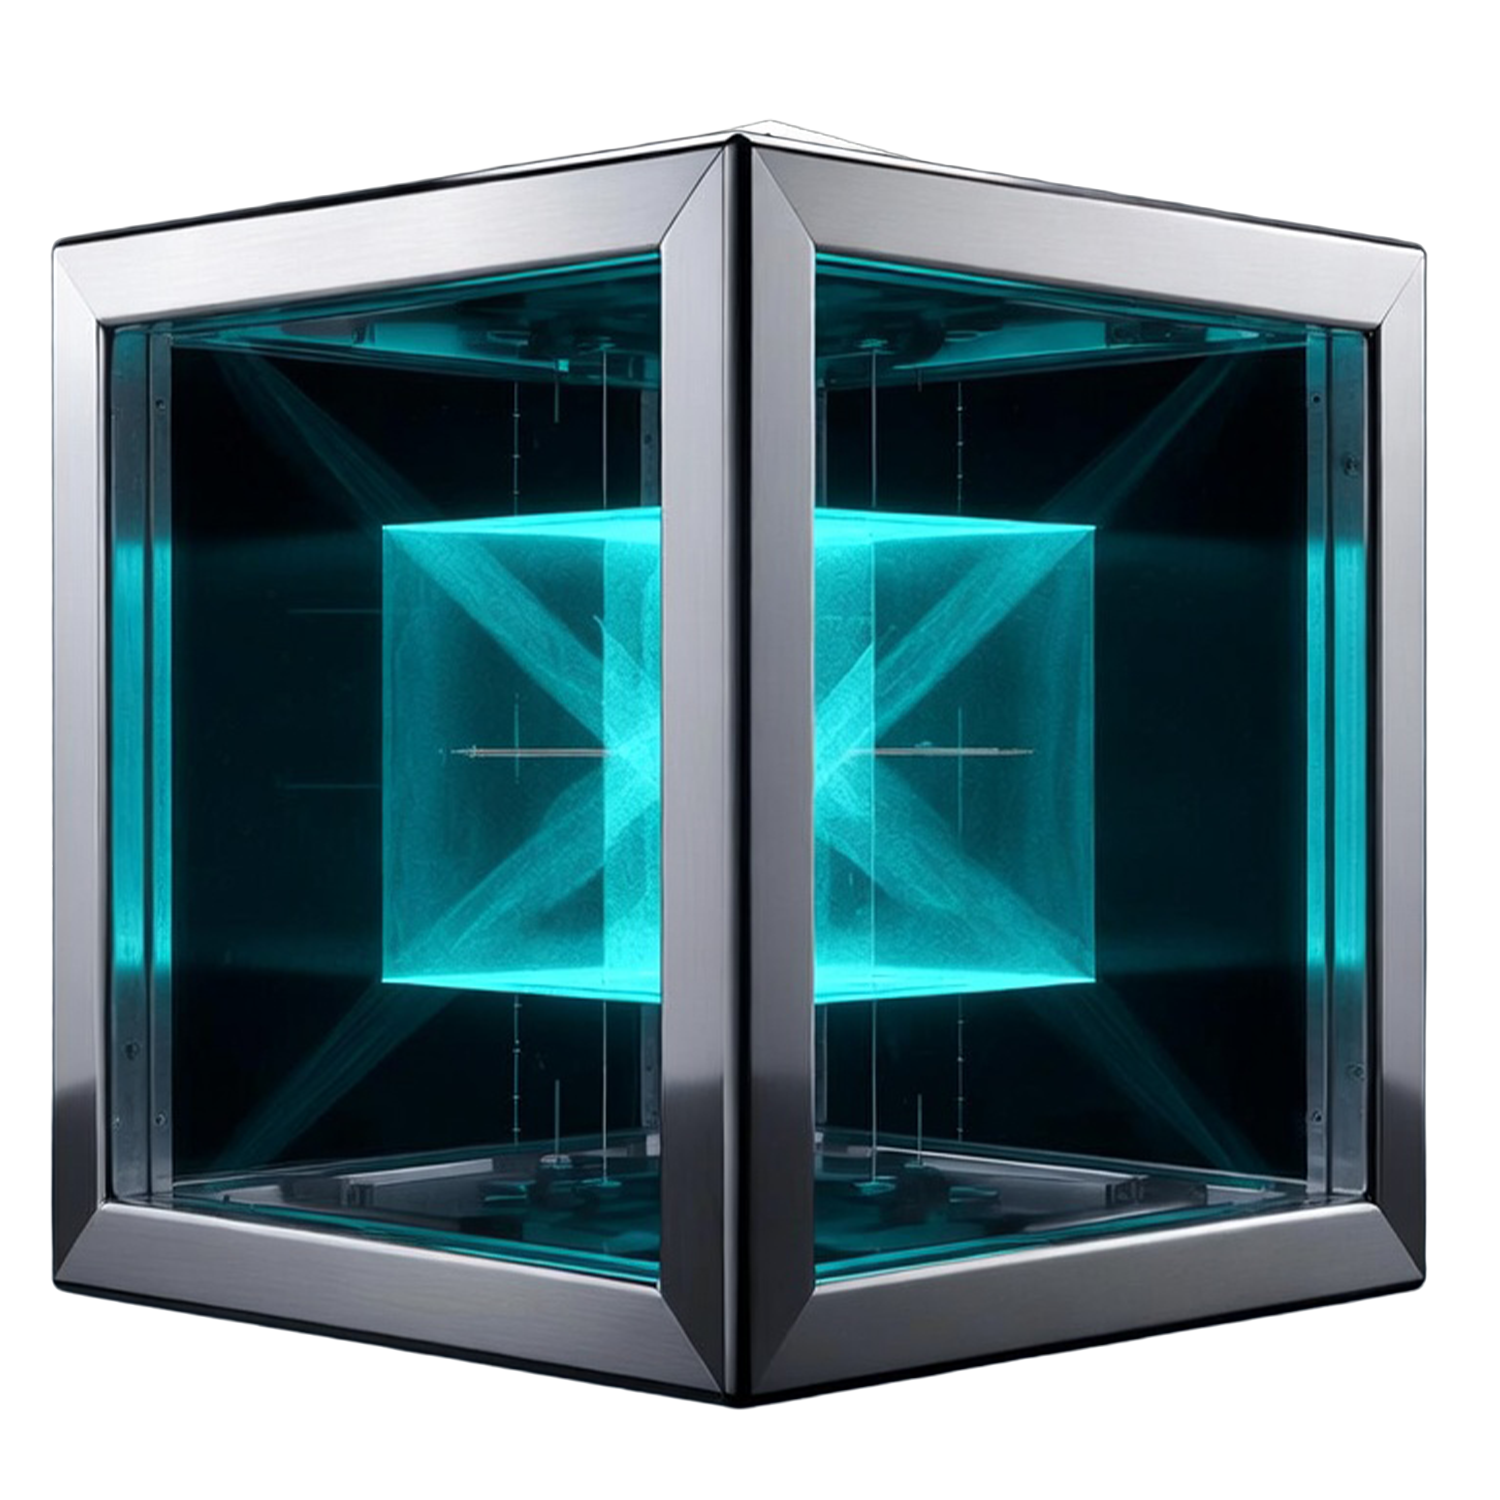
Follow the moving probes across the geographic field. Inspect a highlighted record, its references and its sector context. Look for connections that give you a reason to examine a group of records together.
You do not have to know the final question before beginning the discovery. A connected group of records can expose an overlooked dependency, a possible explanation or a new research lead. Your team gets a focused investigation and the records needed to test it.
This public view uses bundled ledger snapshots and demonstration calculations to illustrate the scanning step. It does not receive a live result from the Data Lake. Display positions and highlights guide exploration; candidate connections still need scientific and causal qualification.

The discovery begins in the structure of the evidence. Quantum and classical observations form geometric neighbourhoods. Connections between those neighbourhoods give us a reason to examine records together, even when their original labels, owners or purposes seem unrelated.
As an illustration, imagine a trail through thirty documents that nobody knew to put together. Tomography examines that connected set from several views. An overlooked record can become the missing connection, revealing a question nobody thought to ask.
Quantum reference → Seattle / MSP → Cellulose in timber → Lumber → Homebuilding → Household Durables → Consumer Durables & Apparel → Consumer Discretionary → D.R. Horton (DHI)
Suppose lumber futures fall 15%. Cheaper lumber could lower future building costs and support homebuilder margins. Follow the chain from timber to housing exposure.

Start with D.R. Horton as the company example, then examine the wider Homebuilding industry. Existing purchases, mortgage rates and home demand may outweigh the saving.
Quantum measurements contribute their geometry. Tavnit and Netzer transform classical records into comparable forms. Sources stay attached, including records whose importance is not yet apparent.
A centroid marks the representative centre of a geometry. Nearby centres, overlapping shapes and their uncertainty identify candidate relationships when the comparison requirements are met.
One neighbourhood links to another. Following that trail can bring seemingly unrelated records into the same investigation, without requiring someone to have searched for that particular combination.
Inspect the connected evidence across several views, including place, time and sector. A structure that is hard to see in separate records can become a question worth testing.
Return to the contributing records. Test timing, competing explanations and missing evidence. The customer gains a new lead, its evidence trail and a practical next investigation.
Your team gains a question it did not know to ask, the records that brought it into view and a focused next step. Information that seemed irrelevant can become the reason to investigate a supplier, a material, an operating problem or a new research lead.
The lake combines retained records with authored geometry and illustrative industry connections. Geometric convergence guides investigation; it does not establish causation or a price forecast.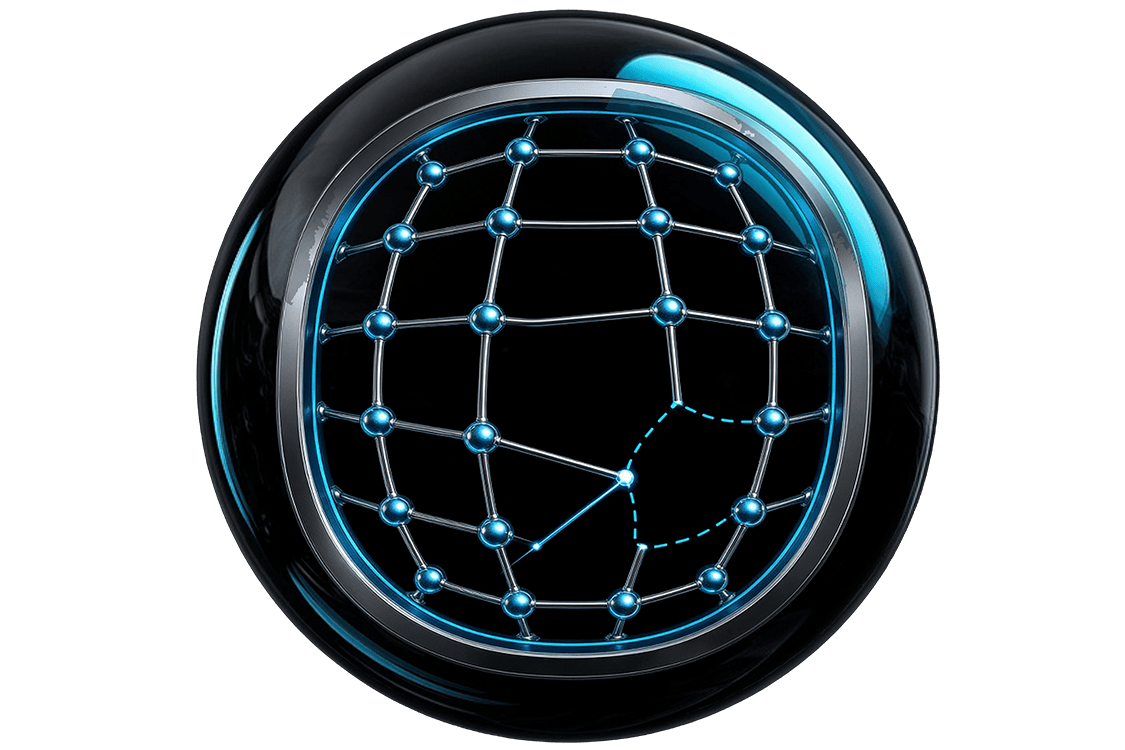
You have seen the shared geometry, connected evidence and tomography. Explore the research behind discovering a question before anyone knew to ask it.
Explore the researchA geometric trail can bring an overlooked group of records into view. Tomography helps examine the pattern across that group. Causal AI can then investigate why it appears, using the contributing records, timing and uncertainty to test explanations. Discovery supplies a question the team did not have at the start.
Cheaper lumber could lower future building costs and support homebuilder margins. Follow the chain from timber to housing exposure.
Evidence to investigate: Existing purchases, mortgage rates and home demand may outweigh the saving.
Investigate whether an unusual identity event and a network change share a defensible timeline. Challenge the connection with maintenance records, permissions, and independent observations.
Explore whether a transport change preceded degraded performance. Compare other regions and workload changes before attributing the fault or proposing remediation.
LEARN MOREHow does a discovered connection become an explanation?What you’re seeing. What’s different. Why it matters to you.Find the connection first. Test what caused it next.
A customer investigating repeated failures can inspect the evidence for an explanation before changing equipment or procedures. A missing piece becomes a specific next measurement instead of an unsupported confident answer.
Discovery points investigators toward related observations. Causal analysis asks which event came first, whether the sources are independent, and whether a different explanation could account for the same pattern.
Events moving together can be a useful clue, but agreement alone does not identify a cause. EcoSynQ keeps discovery, timing, alternative explanations and independent challenge as distinct responsibilities.
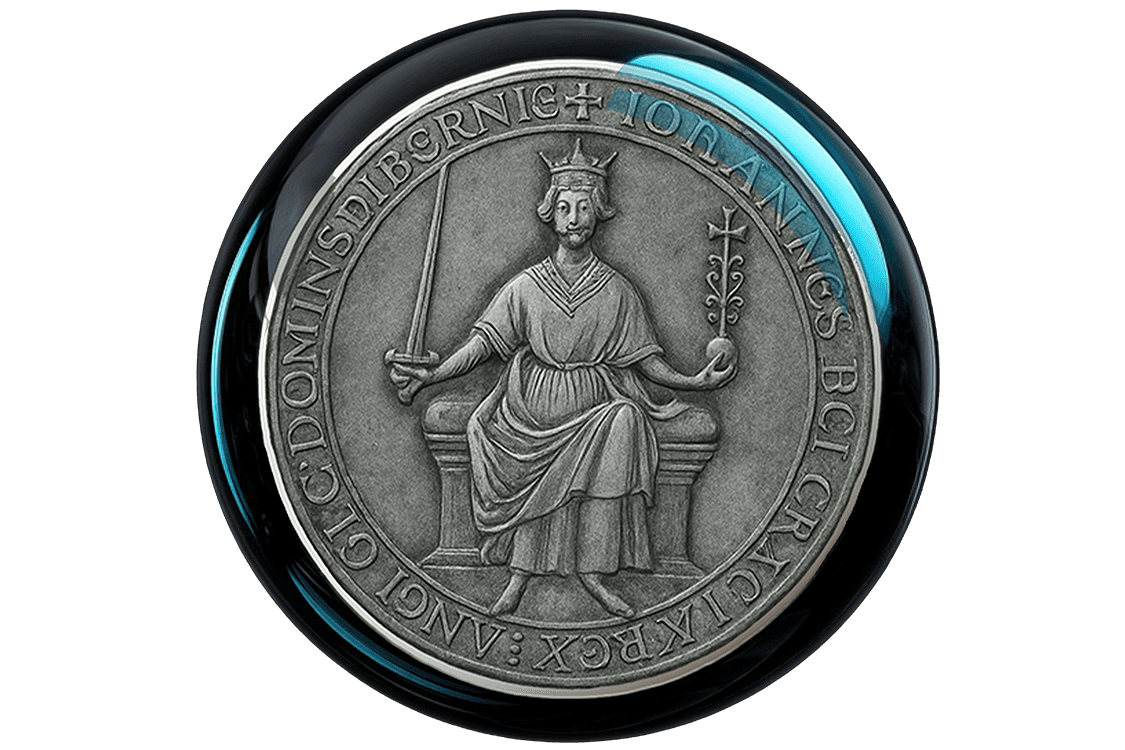
Quantum Trellis opens a new question. Tomography returns to the records. Follow how the epochHeader, Magna Carta and independent challenge keep the discovery connected to what its evidence can support.
Explore the ten-stage roadmap
The lake shows a geometric neighbourhood at a moment in the demonstration. Following observations over time lets an investigator ask whether a candidate relationship persists, separates, or changes around an event.
If clock uncertainty overlaps, those timestamps alone cannot establish which event came first.

TINT extends temporal observation into trajectories and system transitions. For infrastructure investigations, that context helps distinguish a persistent relationship from a coincidence during changing network conditions.
Peer topology, direct or relayed transport, connectivity, routing, and region.
Traffic, handshake age, performance, stability, and transitions between operating regimes.
A transport transition appears near a performance change.
CHALLENGE THE EXPLANATIONDid it precede the change? Did unaffected peers behave differently? Could workload or another shared cause explain both?
In the lake, another clue can tighten the shared region—or remain outside it. Investigation must also check whether sources are truly independent, whether their meanings and time windows align, and whether another explanation fits the evidence.
Compatible, independent observations support further investigation. Repeated copies of one source do not count as independent confirmation.
A separated observation may expose a mismatch, a changing condition, or a misleading initial relationship. Preserve it and investigate the disagreement.
Missing timing or an untested alternative identifies the next evidence to seek. Keep the question open until those gaps can be resolved.
A useful discovery can remain a candidate while its causal explanation is unproven.
The lake reveals where independent clues converge. The discovery fabric preserves how they got there. Causal investigation determines what those relationships can support.
Capture activity, state changes, and the evidence behind each observation.
Use discovery to focus the question, then examine timing, alternatives, and evidence that could contradict the explanation.
Each connection is more useful when an investigator can trace who supplied the evidence, when it was observed, how it travelled, and whether it is eligible for the proposed analysis.
Identity → defensible time → transport context → evidence admission → protected computation.Establish who supplied evidence and the authority associated with that identity.
QHI · Quantum Human Identity
Preserve temporal context and uncertainty so event ordering can be examined.
Atomic DTG + TINTRetain the topology and transport conditions surrounding an observation.
Causal Headscale + Causal Tailscale + Causal WireGuard
Evaluate whether evidence meets the requirements of the proposed computation.
Causal State Assessment + Evidence-Backed Admission
Protect evidence through storage and exchange; security alone does not establish its scientific truth.
Post-Quantum Security
Continue into Continuum to explore how the platform connects discovery, evidence, and computation.
Explore Continuum